April is coming to an end, what did it bring us, besides information concerns, we will try to find out in the technical analysis.
The widespread sell-off of the US dollar has been observed in the market since the beginning of April, where the euro and the pound sterling are seeking to resume the medium-term upward trend after more than three months of correction.
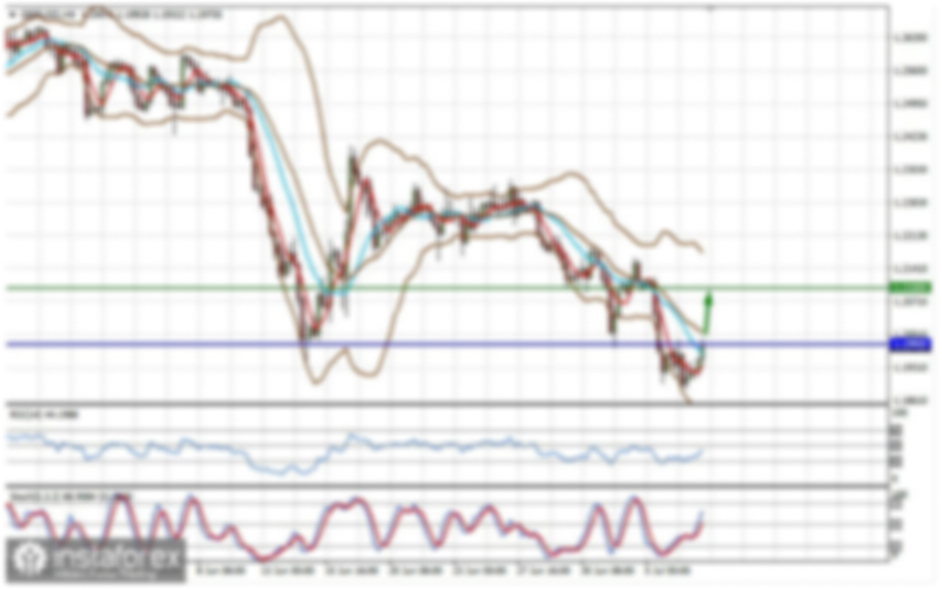
The scale of the euro's strengthening in April is more than 3.7% against the 5.2% decline during the correction period. The rate of price change is so fast that a V-shaped formation has appeared on the market, which is not quite typical for the euro and can signal a large influence on the quotes from speculators. From the point of view of technical analysis, the existing movement belongs to the class of inertia, where there are no corrections and pullbacks (daily period), which eventually leads to a strong overheating of long positions.
The inertial course has a direct line of communication with speculators, so it is impossible to thoroughly determine the pivot point, there are only assumptions.
One of the closest areas of interaction of trading forces is the price stagnation of 1.2180, which has repeated repetitions in history. This method is known to many traders, we can only hope for a natural basis of the past and the effect of the crowd.
In theory, everything looks great, but in practice, we know how insidious speculators can be, and sometimes there is no logic.
Therefore, the breakdown and consolidation of the price above 1.2180 may well lead to a new round of speculation, which will lead to a movement towards the main maximum of January 6 at 1.2349.
At this stage, it becomes even more interesting. In previous reviews from January, we pointed out many times that the euro has strengthened so much that it does not just run counter to fundamental analysis, but technical analysis is bursting under the pressure of buyers.
The fact is that the local peak of January 6 at 1.2349, is near the peak of the previous medium-term trend of 2018, and this is already an attempt on the long-term trend.
In simple terms, the breakdown of the 1.2500 price area will not only result in a renewal of the 2018 high, it casts doubt on the long-term downward trend from 2008.
To put it even more simply, the breakdown of the peak of 2018 teleports the current quotes to the levels of 2014, and now we recall all the economic problems of Europe in comparison with more or less the situation in the United States.
At this stage, I propose to stop and take a breath, since all the available movements are just a speculative game, where there is sometimes no logic, that is why many traders have changed their trading tactics from basic positions to short-term ones.
With the European currency sorted out, in general terms, it became clear that the market is ruled by speculators and, in principle, everything can be expected from them. Now let's move on to the fellow market pound sterling, where the situation is no better, and perhaps even worse, than the euro.
The GBP/USD currency pair, unlike EUR/USD, has a much greater strengthening of the exchange rate in 2020, but the scale of the correction in early 2021 is much smaller. Taking into account the upward movement in April, the pound sterling won back the corrective movement (1.4224-1.3669) by more than 60%.
The only thing traders are trying to grab onto is the area of the psychological level 1.3950/1.4000/1.4050, but taking into account recent fluctuations and a high coefficient of speculative transactions, market participants are already preparing for a possible breakout of the key area, which will lead to an update of the local maximum from February 24 - 1.4224.
At this stage, there is silence, as logic and common sense are absent behind the veil of greedy speculators who do not pay attention to the huge economic problems of the UK, caused not only by the coronavirus crisis but also by Brexit, which already has its impact after the signing of the agreement.
In simple words, in the medium term, there is nothing positive for the pound sterling, and you should not grab the positive vaccination program for the population, the effect of which will override other problems within the country.
Let's return to the technical component, and here we see that the local peak from February 24, at 1.4224, is close to the peak of 2018, which is the area of 1.4350, the breakdown of which will lead to a shift in the chart to the levels of 2016, and this casts doubt on the long-term trend from 2008.
What to do in this case?
The priority is not to go against speculators, the experience of 2020 proved that this is useless, even when technical and fundamental factors indicate it.
Second-forget about medium-term operations, the market is still very feverish, now we are going up, breaking through all possible and impossible ceilings, and tomorrow we can go down, so it is better to follow the short-term prospects regarding the current market conditions.