


signal strength 4 of 5

According to the chart of H1, #Bitcoin formed the Bearish Symmetrical Triangle pattern. Description: The lower border is 81178.46/83101.84 and upper border is 85102.23/83101.84. The pattern width is measured on the chart at -392377 pips. The formation of the Bearish Symmetrical Triangle pattern evidently signals a continuation of the downward trend. In other words, if the scenario comes true and #Bitcoin breaches the lower border, the price could continue its move toward 83101.44.
- All
- Double Top
- Flag
- Head and Shoulders
- Pennant
- Rectangle
- Triangle
- Triple top
- All
- #AAPL
- #AMZN
- #Bitcoin
- #EBAY
- #FB
- #GOOG
- #INTC
- #KO
- #MA
- #MCD
- #MSFT
- #NTDOY
- #PEP
- #TSLA
- #TWTR
- AUDCAD
- AUDCHF
- AUDJPY
- AUDUSD
- EURCAD
- EURCHF
- EURGBP
- EURJPY
- EURNZD
- EURRUB
- EURUSD
- GBPAUD
- GBPCHF
- GBPJPY
- GBPUSD
- GOLD
- NZDCAD
- NZDCHF
- NZDJPY
- NZDUSD
- SILVER
- USDCAD
- USDCHF
- USDJPY
- USDRUB
- All
- M5
- M15
- M30
- H1
- D1
- All
- Buy
- Sale
- All
- 1
- 2
- 3
- 4
- 5
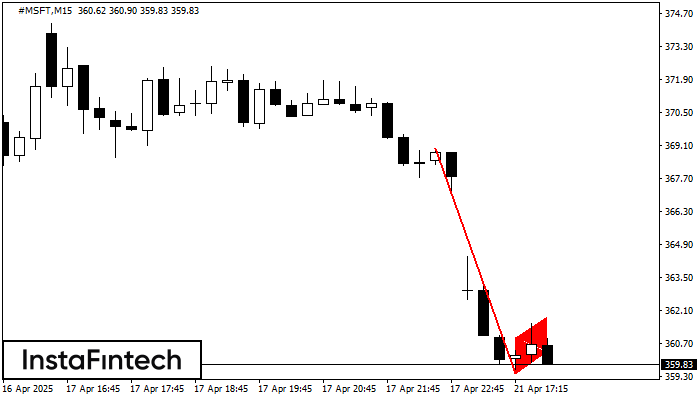
The Bearish Flag pattern has been formed on the chart #MSFT M15 which signals that the downward trend will continue. If the price breaks below the low at 359.45, then
The M5 and M15 time frames may have more false entry points.
Открыть график инструмента в новом окне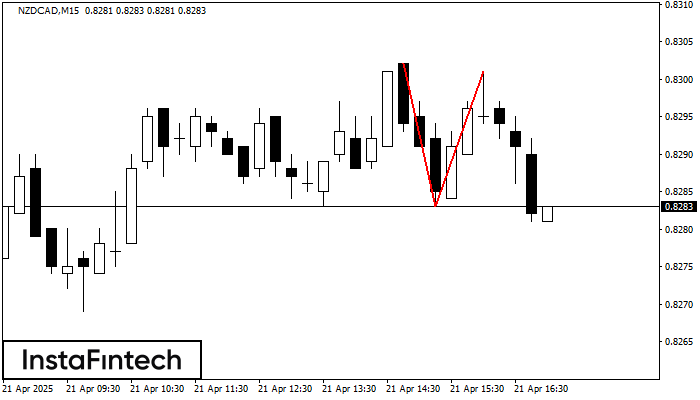
The Double Top pattern has been formed on NZDCAD M15. It signals that the trend has been changed from upwards to downwards. Probably, if the base of the pattern 0.8283
The M5 and M15 time frames may have more false entry points.
Открыть график инструмента в новом окне
According to the chart of M15, #Bitcoin formed the Bullish Symmetrical Triangle pattern. Description: This is the pattern of a trend continuation. 87754.54 and 86429.29 are the coordinates
The M5 and M15 time frames may have more false entry points.
Открыть график инструмента в новом окне


