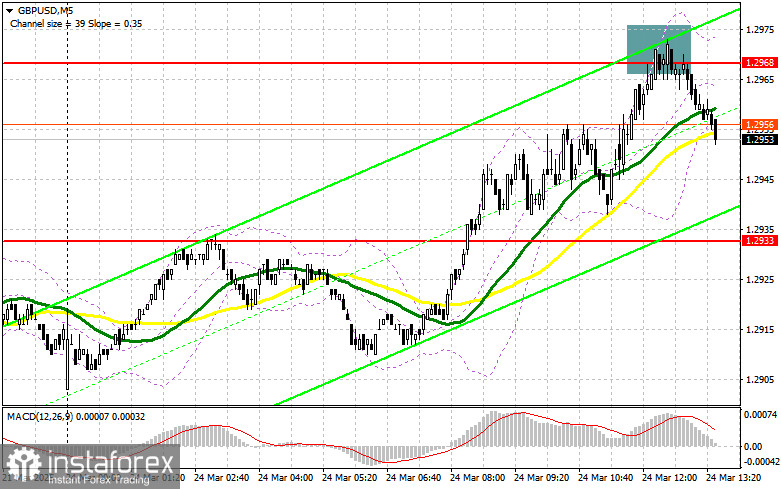
In my morning forecast, I highlighted the level of 1.2968 and planned to make trading decisions based on it. Let's look at the 5-minute chart and analyze what happened. The rise and formation of a false breakout around 1.2968 provided a good entry point for selling the pound, which resulted in a 20-point decline. The technical picture for the second half of the day was slightly revised.
To open long positions on GBP/USD:
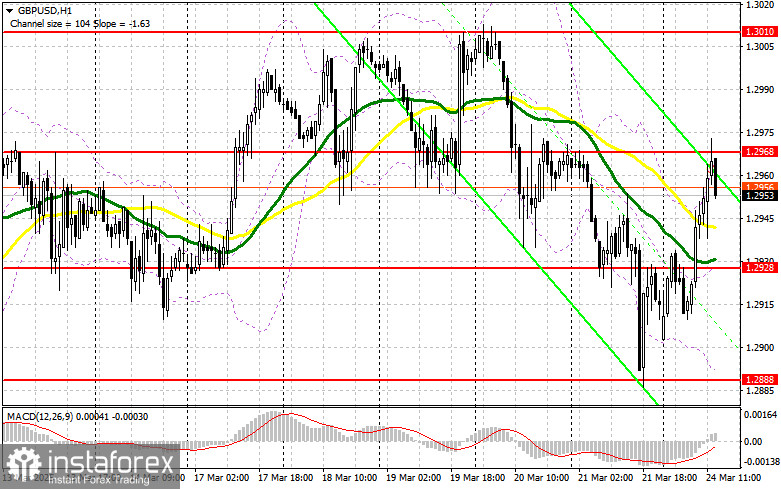
Weak UK manufacturing sector data was offset by strong performance in the services sector. In the second half of the day, alongside similar indicators from the US, we expect speeches from FOMC members Raphael Bostic and Michael S. Barr. Only a hawkish tone from policymakers could bring back pressure on the pound. Otherwise, the pair may continue to rise—especially if US data is strong. In the event of a bearish reaction to those remarks, only a false breakout around 1.2928 will serve as a good entry point for long positions with the goal of recovering to the 1.2968 resistance, which has not yet been breached. A breakout and retest of this range from top to bottom will offer a new entry point for long positions aiming to update 1.3010, bringing back a bullish market. The furthest target will be the 1.3056 area, where I plan to take profit. If GBP/USD declines and bulls show no activity around 1.2928 in the second half of the day, pressure on the pound will increase significantly, potentially affecting the pair's bullish prospects. In this case, a false breakout near 1.2888 would be a suitable condition for opening long positions. I plan to buy GBP/USD immediately on a rebound from the 1.2846 support level, targeting an intraday correction of 30–35 points.
To open short positions on GBP/USD:
The pound rose significantly, but sellers are still present, as was clearly shown around the 1.2968 area. This level remains the focal point for the second half of the day. A false breakout there, similar to the scenario discussed earlier, will provide an entry point for selling with the target at 1.2928. A breakout and retest of this range from bottom to top will trigger stop-loss orders and open the path to 1.2888, which would already represent a notable correction. The furthest target will be the 1.2846 area, where I plan to take profit. Testing this level may stop the development of the bullish market. If demand for the pound persists in the second half of the day and bears fail to act around 1.2968, then it would be better to postpone short positions until the pair tests resistance at 1.3010. I will sell there only on a false breakout. If there's no downward movement there either, I'll look for short positions on a rebound from 1.3056, targeting a 30–35 point intraday correction.
COT Report (Commitment of Traders) for March 11:
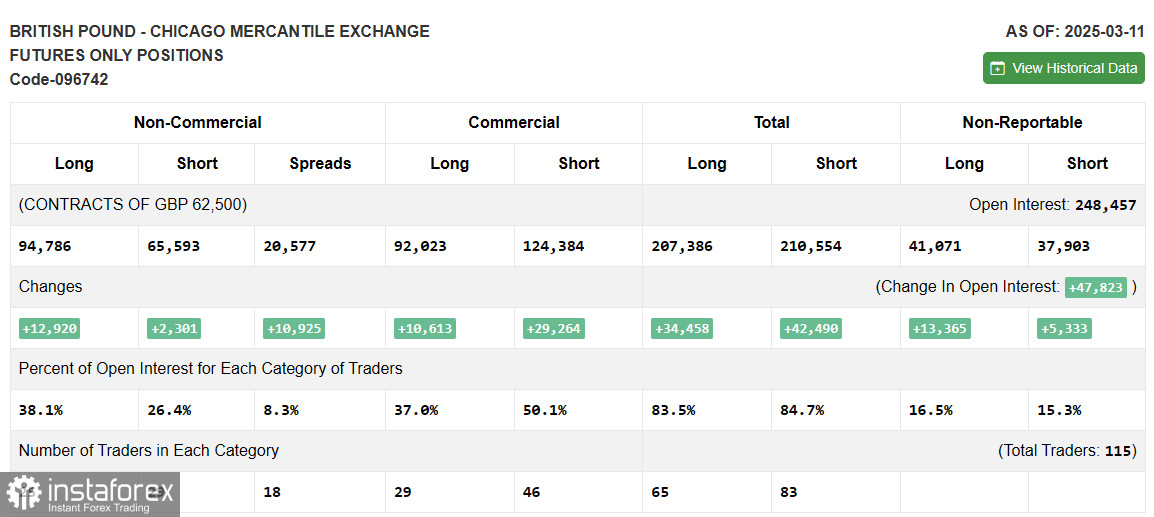
There was an increase in both long and short positions, with long positions growing significantly more, making the advantage of pound buyers more apparent. This is also reflected on the GBP/USD chart. Considering positive trends in the UK economy and the Bank of England's relatively gradual approach to interest rate cuts, it's possible that GBP/USD will continue rising. The upcoming Fed meeting may further weaken the dollar, so pound buyers have little to worry about for now. However, traders should still be cautious of corrections that may arise on the path to new local highs. The latest COT report shows that long non-commercial positions increased by 12,920 to 94,786, while short non-commercial positions grew by only 2,301 to 65,593. As a result, the gap between long and short positions widened by 10,925.
Indicator Signals:
Moving Averages
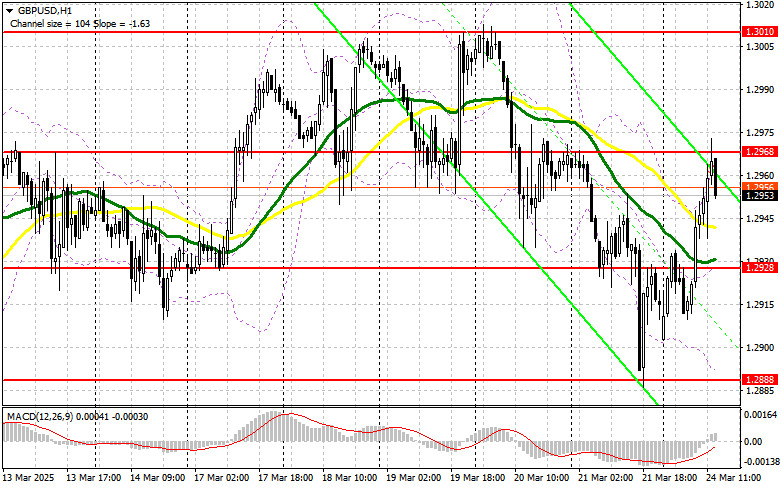
Trading is occurring below the 30- and 50-period moving averages, which indicates a market correction.
Note: The periods and prices of the moving averages are based on the author's analysis on the H1 chart and differ from the classic daily moving averages on the D1 chart.
Bollinger Bands
In the event of a decline, the lower boundary of the indicator around 1.2950 will act as support.
Indicator Descriptions:
• Moving Average (used to determine the current trend by smoothing out volatility and noise). Period – 50, marked in yellow on the chart; • Moving Average. Period – 30, marked in green on the chart; • MACD Indicator (Moving Average Convergence/Divergence). Fast EMA – period 12, Slow EMA – period 26, SMA – period 9; • Bollinger Bands. Period – 20; • Non-commercial traders – speculators such as individual traders, hedge funds, and large institutions using the futures market for speculative purposes and meeting specific requirements; • Long non-commercial positions represent the total long open position of non-commercial traders; • Short non-commercial positions represent the total short open position of non-commercial traders; • Total non-commercial net position is the difference between short and long positions held by non-commercial traders.