

signal strength 3 of 5
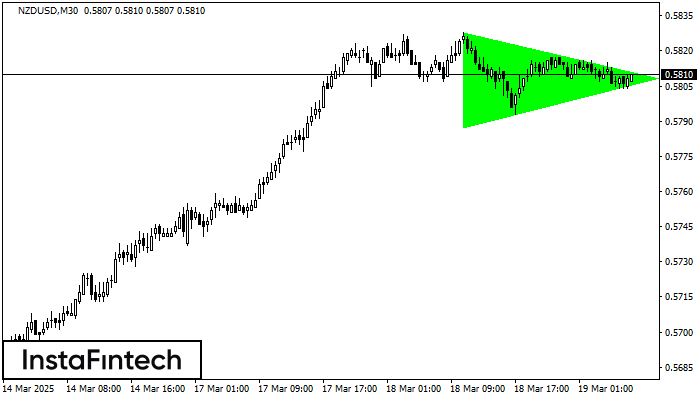
According to the chart of M30, NZDUSD formed the Bullish Symmetrical Triangle pattern. Description: This is the pattern of a trend continuation. 0.5828 and 0.5788 are the coordinates of the upper and lower borders respectively. The pattern width is measured on the chart at 40 pips. Outlook: If the upper border 0.5828 is broken, the price is likely to continue its move by 0.5838.
- All
- Double Top
- Flag
- Head and Shoulders
- Pennant
- Rectangle
- Triangle
- Triple top
- All
- #AAPL
- #AMZN
- #Bitcoin
- #EBAY
- #FB
- #GOOG
- #INTC
- #KO
- #MA
- #MCD
- #MSFT
- #NTDOY
- #PEP
- #TSLA
- #TWTR
- AUDCAD
- AUDCHF
- AUDJPY
- AUDUSD
- EURCAD
- EURCHF
- EURGBP
- EURJPY
- EURNZD
- EURRUB
- EURUSD
- GBPAUD
- GBPCHF
- GBPJPY
- GBPUSD
- GOLD
- NZDCAD
- NZDCHF
- NZDJPY
- NZDUSD
- SILVER
- USDCAD
- USDCHF
- USDJPY
- USDRUB
- All
- M5
- M15
- M30
- H1
- D1
- All
- Buy
- Sale
- All
- 1
- 2
- 3
- 4
- 5
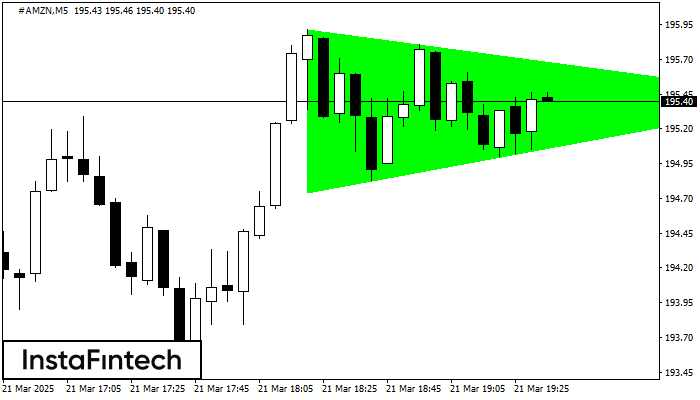
M5 के चार्ट के अनुसार, #AMZN से बुलिश सिमेट्रिकल त्रिभुज पैटर्न बना। पैटर्न की निचली सीमा ने निर्देशांक 194.75/195.42 को स्पर्श किया जबकि ऊपरी सीमा 195.92/195.42 के पार गई। यदि
M5 और M15 समय सीमा में अधिक फाल्स एंट्री पॉइंट्स हो सकते हैं।
Open chart in a new window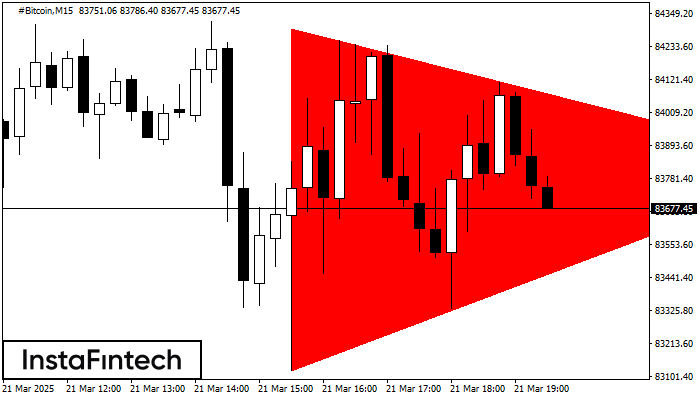
M15 के चार्ट के अनुसार, #Bitcoin से बियरिश सिमेट्रिकल त्रिभुज पैटर्न बना। विवरण: निचली सीमा 83121.29/83823.64 है और ऊपरी सीमा 84297.08/83823.64 है। पैटर्न की चौड़ाई चार्ट पर -117579 पिप्स
M5 और M15 समय सीमा में अधिक फाल्स एंट्री पॉइंट्स हो सकते हैं।
Open chart in a new window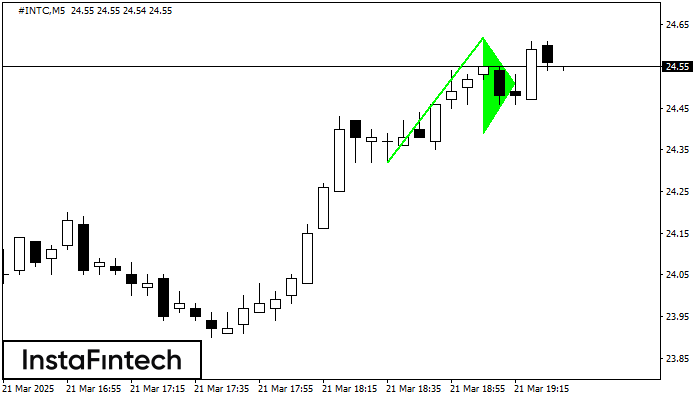
बुलिश पताका पैटर्न #INTC M5 चार्ट पर बनता है। यह एक प्रकार का निरंतरता पैटर्न है। अगर कीमत पेनेन्ट के उच्च स्तर 24.62 से ऊपर फिक्स होती है तो
M5 और M15 समय सीमा में अधिक फाल्स एंट्री पॉइंट्स हो सकते हैं।
Open chart in a new window


