


signal strength 1 of 5
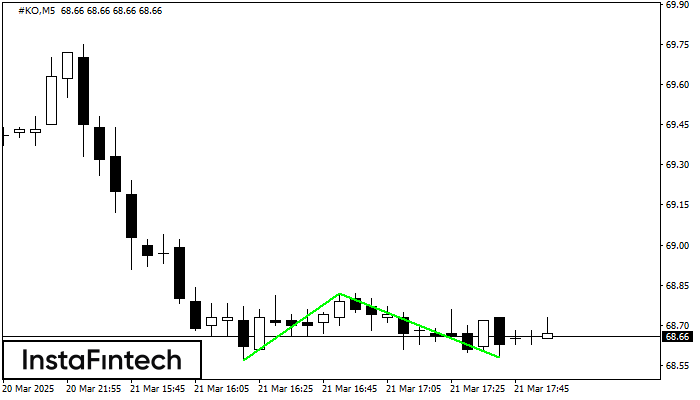
The Double Bottom pattern has been formed on #KO M5. This formation signals a reversal of the trend from downwards to upwards. The signal is that a buy trade should be opened after the upper boundary of the pattern 68.82 is broken. The further movements will rely on the width of the current pattern 25 points.
The M5 and M15 time frames may have more false entry points.
See Also
- All
- Double Top
- Flag
- Head and Shoulders
- Pennant
- Rectangle
- Triangle
- Triple top
- All
- #AAPL
- #AMZN
- #Bitcoin
- #EBAY
- #FB
- #GOOG
- #INTC
- #KO
- #MA
- #MCD
- #MSFT
- #NTDOY
- #PEP
- #TSLA
- #TWTR
- AUDCAD
- AUDCHF
- AUDJPY
- AUDUSD
- EURCAD
- EURCHF
- EURGBP
- EURJPY
- EURNZD
- EURRUB
- EURUSD
- GBPAUD
- GBPCHF
- GBPJPY
- GBPUSD
- GOLD
- NZDCAD
- NZDCHF
- NZDJPY
- NZDUSD
- SILVER
- USDCAD
- USDCHF
- USDJPY
- USDRUB
- All
- M5
- M15
- M30
- H1
- D1
- All
- Buy
- Sale
- All
- 1
- 2
- 3
- 4
- 5

The Double Bottom pattern has been formed on #Bitcoin M5. Characteristics: the support level 83931.70; the resistance level 84051.13; the width of the pattern 11943 points. If the resistance level
The M5 and M15 time frames may have more false entry points.
Open chart in a new window
According to the chart of M5, AUDUSD formed the Bullish Symmetrical Triangle pattern. Description: This is the pattern of a trend continuation. 0.6279 and 0.6267 are the coordinates
The M5 and M15 time frames may have more false entry points.
Open chart in a new window
According to the chart of M5, USDCHF formed the Bullish Symmetrical Triangle pattern. The lower border of the pattern touches the coordinates 0.8825/0.8830 whereas the upper border goes across 0.8835/0.8830
The M5 and M15 time frames may have more false entry points.
Open chart in a new window


