

signal strength 1 of 5
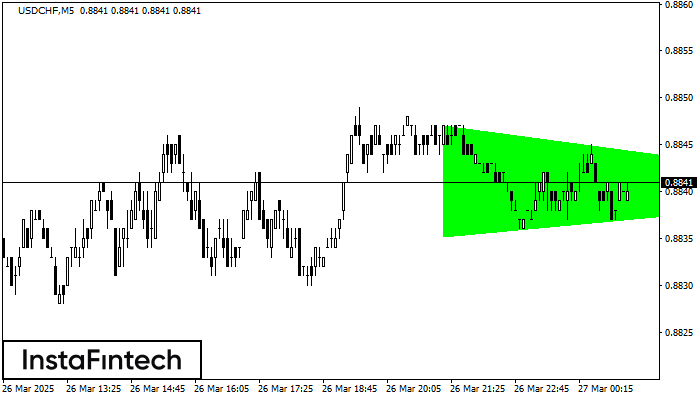
According to the chart of M5, USDCHF formed the Bullish Symmetrical Triangle pattern. Description: This is the pattern of a trend continuation. 0.8847 and 0.8835 are the coordinates of the upper and lower borders respectively. The pattern width is measured on the chart at 12 pips. Outlook: If the upper border 0.8847 is broken, the price is likely to continue its move by 0.8855.
The M5 and M15 time frames may have more false entry points.
یہ بھی دیکھیں
- All
- Double Top
- Flag
- Head and Shoulders
- Pennant
- Rectangle
- Triangle
- Triple top
- All
- #AAPL
- #AMZN
- #Bitcoin
- #EBAY
- #FB
- #GOOG
- #INTC
- #KO
- #MA
- #MCD
- #MSFT
- #NTDOY
- #PEP
- #TSLA
- #TWTR
- AUDCAD
- AUDCHF
- AUDJPY
- AUDUSD
- EURCAD
- EURCHF
- EURGBP
- EURJPY
- EURNZD
- EURRUB
- EURUSD
- GBPAUD
- GBPCHF
- GBPJPY
- GBPUSD
- GOLD
- NZDCAD
- NZDCHF
- NZDJPY
- NZDUSD
- SILVER
- USDCAD
- USDCHF
- USDJPY
- USDRUB
- All
- M5
- M15
- M30
- H1
- D1
- All
- Buy
- Sale
- All
- 1
- 2
- 3
- 4
- 5

O padrão Topo duplo foi formado em #Bitcoin M5. Isso sinaliza que a tendência foi alterada de cima para baixo. Provavelmente, se a base do padrão 85200.45 for quebrada
Os intervalos M5 e M15 podem ter mais pontos de entrada falsos.
Open chart in a new window
Conforme o gráfico de M5, #Bitcoin formou o Retângulo de alta. Este tipo de padrão indica uma continuação da tendência. Ele consiste em dois níveis: resistência 85457.12 e suporte 85308.07
Os intervalos M5 e M15 podem ter mais pontos de entrada falsos.
Open chart in a new window
O padrão de reversão Topo duplo foi formado em #Bitcoin M5. Características: o limite superior 85455.73; o limite inferior 85324.27; a largura do padrão é de 13285 pontos. As operações
Os intervalos M5 e M15 podem ter mais pontos de entrada falsos.
Open chart in a new window


