

signal strength 1 of 5
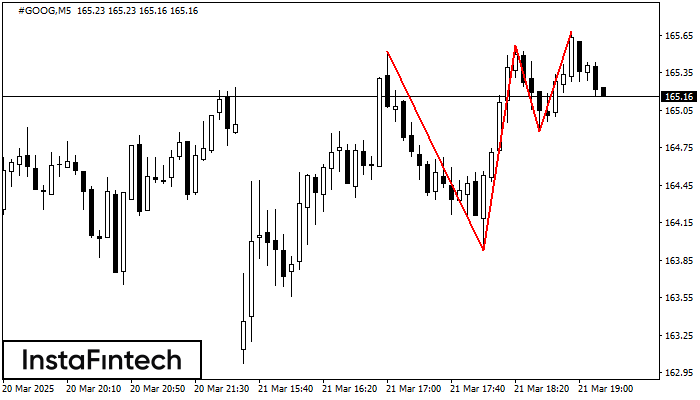
The Triple Top pattern has formed on the chart of the #GOOG M5 trading instrument. It is a reversal pattern featuring the following characteristics: resistance level -16, support level -95, and pattern’s width 159. Forecast If the price breaks through the support level 163.93, it is likely to move further down to 165.42.
The M5 and M15 time frames may have more false entry points.
Veja também
- All
- Double Top
- Flag
- Head and Shoulders
- Pennant
- Rectangle
- Triangle
- Triple top
- All
- #AAPL
- #AMZN
- #Bitcoin
- #EBAY
- #FB
- #GOOG
- #INTC
- #KO
- #MA
- #MCD
- #MSFT
- #NTDOY
- #PEP
- #TSLA
- #TWTR
- AUDCAD
- AUDCHF
- AUDJPY
- AUDUSD
- EURCAD
- EURCHF
- EURGBP
- EURJPY
- EURNZD
- EURRUB
- EURUSD
- GBPAUD
- GBPCHF
- GBPJPY
- GBPUSD
- GOLD
- NZDCAD
- NZDCHF
- NZDJPY
- NZDUSD
- SILVER
- USDCAD
- USDCHF
- USDJPY
- USDRUB
- All
- M5
- M15
- M30
- H1
- D1
- All
- Buy
- Sale
- All
- 1
- 2
- 3
- 4
- 5

O padrão Topo triplo se formou no gráfico de EURJPY M5. Características do padrão: os limites têm um ângulo ascendente; a linha inferior do padrão tem as coordenadas 162.59/162.72
Os intervalos M5 e M15 podem ter mais pontos de entrada falsos.
Open chart in a new window
O padrão Bandeira de Alta foi formado no gráfico NZDJPY M15, o que sinaliza que a tendência ascendente continuará. Sinais: uma quebra do pico em 86.28 pode empurrar o preço
Os intervalos M5 e M15 podem ter mais pontos de entrada falsos.
Open chart in a new window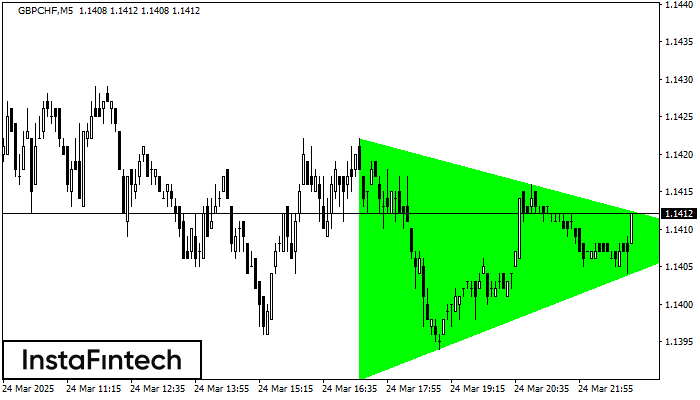
De acordo com o gráfico de M5, GBPCHF formaram o padrão de Triângulo Simétrico de Alta. Descrição: Este é o padrão de uma continuação de tendência. 1.1422 e 1.1390
Os intervalos M5 e M15 podem ter mais pontos de entrada falsos.
Open chart in a new window


