empty
14.04.2023 12:52 AM
Technical analysis of GBP/USD for April 13, 2023

This image is no longer relevant

Overview :

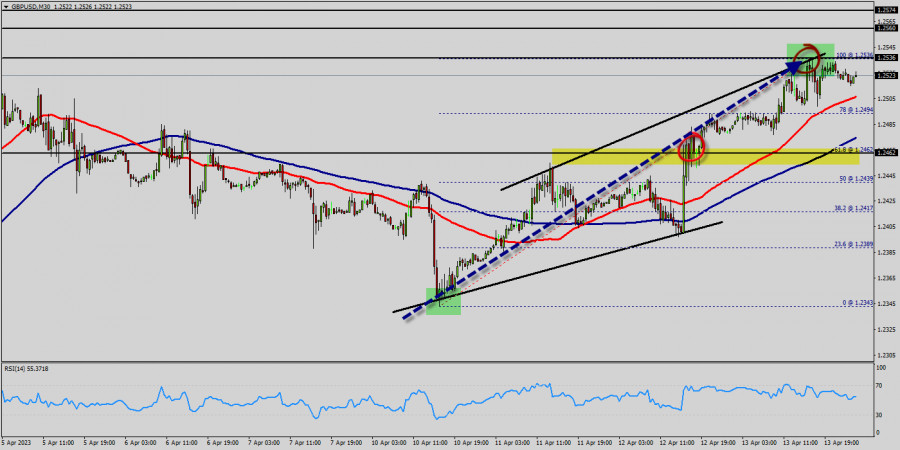
The GBPUSD pair traded with strong positivity yesterday to return to the bullish channel that appears on the chart, to head towards achieving expected additional gains in the upcoming sessions, targeting visiting 1.2522 level mainly. Therefore, we expect to witness more bullish bias in the upcoming sessions, noting that breaking 1.2462 and holding above it will stop the positive scenario and push the price to decline again.

The expected trading range for today is between 1.2462 support and 1.2560 resistance. The GBP/USD pair is going to continue to rise from the level of 1.2462 in the long term.

It should be noted that the support is established at the level of 1.2462 which represents the 61.8% Fibonacci retracement level on the M30 chart. The price is likely to form a double bottom in the same time frame. Accordingly, the GBP/USD pair is showing signs of strength following a breakout of the highest level of 1.2462.

So, buy above the level of 1.2462 with the first target at 1.2536 in order to test the daily resistance 1; and further to 1.2560.

Also, it might be noted that the level of 1.2560 is a good place to take profit because it will form a double top. The price is in a bullish channel now. In the Forex market, liquidity pertains to a currency pair's ability to be bought and sold at the current market price. Additionally, liquidity refers to market volatility and dynamics. Because the Forex market is colossal, it is also extremely liquid. Moreover, if a currency pair has high level of liquidity, it will be easier to trade.

On the other hand, in case a reversal takes place and the GBP/USD pair breaks through the support level of 1.2462, a further decline to 1.2343 can occur which would indicate a bearish market.

Trading recommendations :

The trend is still bullish as long as the price of 1.2463 is not broken. Thereupon, it would be wise to buy above the price of at 1.2463 with the primary target at 1.2536. Then, the GBP/USD pair will continue towards the second target at 1.2560.

In technical analysis: history usually repeats itself at certain level. So it will be of the wisdom to use historic rates to determine future prices. The technical analysis based only on the technical market data (quotes) with the help of various technical indicators. Moreover, in this book we will be touching on a variety of new techniques for applying numerical strategies, equations, formulas and probabilities. Additionally, we will be shared some of classical analysis such as breakout strategy and trend indicators. Alternative scenario : The breakdown of 1.2463 will allow the pair to go further down to the prices of 1.2403 and 1.2343.

เลือกช่วงเวลา
5
นาที
15
นาที
30
นาที
1
ชั่วโมง
4
ชั่วโมง
1
วัน
1
สัปดาห์
รับผลกำไรจากการเปลี่ยนแปลงอัตราสกุลเงินดิจิทัลกับ InstaForex.
ดาวน์โหลด MetaTrader 4 และเปิดการซื้อขายครั้งแรกของคุณ.
  • Grand Choice
    Contest by
    InstaForex
    InstaForex always strives to help you
    fulfill your biggest dreams.
    เข้าร่วมการแข่งขัน


บทความแนะนำ

EUR/USD. วันที่ 25 มีนาคม สัปดาห์ข้างหน้าน่าเบื่อ

ในวันจันทร์ คู่เงิน EUR/USD ดีดตัวจากระดับ Fibonacci retracement ที่ 200.0% ที่ 1.0857 กลับทิศทางในความโปรดปรานของดอลลาร์สหรัฐ และลดลงไปยังโซนสนับสนุนที่ 1.0781–1.0797 การดีดตัวจากโซนนี้ในวันนี้จะเป็นสัญญาณที่ดีต่อยูโรและกระตุ้นให้เกิดการเคลื่อนไหวด้านราคาขึ้นใหม่ไปที่ระดับ 1.0857

Samir Klishi 18:04 2025-03-25 UTC+2

GBP/USD วันที่ 25 มีนาคม เงินปอนด์เข้าสู่ช่วงการเคลื่อนไหวในช่วงข้าง

บนกราฟรายชั่วโมง คู่เงิน GBP/USD สามารถยืนอยู่เหนือระดับ 1.2931 ได้ในวันจันทร์ แต่ฝั่งแรงซื้อไม่สามารถยืนตลาดให้อยู่ในระดับสูงได้และหลังจากนั้นถอยกลับลงมา คู่เงินดังกล่าวจึงลดลงต่ำกว่าระดับ 1.2931 อีกครั้ง การลดลงอาจดำเนินต่อไปในวันนี้ไปจนถึงระดับ 1.2865 แต่การเคลื่อนไหวของปอนด์ในช่วงไม่กี่สัปดาห์ที่ผ่านมาดูเหมือนว่าจะเป็นแนวโน้มด้านข้าง ดังนั้นฉันไม่คาดว่าราคาจะลดลงต่ำกว่า 1.2865

Samir Klishi 17:58 2025-03-25 UTC+2

สัญญาณการซื้อขายสำหรับทองคำ (XAU/USD) ระหว่างวันที่ 25-27 มีนาคม 2025: ซื้อเมื่อราคาสูงกว่า $3,024 (21 SMA - 7/8 Murray)

ในช่วงเริ่มต้นของเซสชันการซื้อขายอเมริกัน ทองคำกำลังซื้อขายอยู่ที่ประมาณ 3,021 ซึ่งต่ำกว่าระดับ 21-SMA ภายในกรอบแนวโน้มขาลงที่เกิดขึ้นตั้งแต่วันที่ 19 มีนาคม ในกราฟ H4 เราสามารถเห็นว่าทองคำกำลังเผชิญกับแรงกดดันขาลงและคาดว่าจะยังคงซื้อขายอยู่ในกรอบนี้ในอีกไม่กี่วันข้างหน้า หากรูปแบบนี้ถูกทำลายและยึดเหนือ 21-SMA และสูงกว่า 3,025

Dimitrios Zappas 14:00 2025-03-25 UTC+2

การพยากรณ์ตลาดฟอเร็กซ์ 25/03/2025: EUR/USD, USD/CAD, SP500 และ Bitcoin

ลิงก์ที่เป็นประโยชน์: บทความอื่นๆ ของฉันสามารถอ่านได้ในส่วนนี้ คอร์ส InstaForex สำหรับผู้เริ่มต้น การวิเคราะห์ที่ได้รับความนิยม เปิดบัญชีซื้อขาย สำคัญ: ผู้เริ่มต้นในตลาดฟอเร็กซ์ต้องระวังอย่างมากเมื่อตัดสินใจเข้าสู่ตลาด ก่อนที่จะมีการเผยแพร่รายงานสำคัญๆ ควรยืนหยัดไม่เข้าสู่ตลาดเพื่อหลีกเลี่ยงการตกอยู่ในสภาวะผันผวนของตลาดอันรุนแรงจากการเพิ่มขึ้นของความผันผวน หากตัดสินใจจะซื้อขายในช่วงการเผยแพร่ข่าว ควรวางคำสั่งหยุดเพื่อจำกัดการขาดทุนเสมอ หากไม่วางคำสั่งหยุด

Sebastian Seliga 09:56 2025-03-25 UTC+2

การวิเคราะห์ทางเทคนิคของการเคลื่อนไหวราคาทองคำรายวัน วันอังคารที่ 25 มีนาคม 2025

หากเราดูที่กราฟ 4 ชั่วโมงของอินสตรูเมนต์ทองคำ จะเห็นรูปแบบ Bearish 123 ซึ่งตามมาด้วย Bearish Ross Hook (RH) หลายครั้งและยังได้รับการยืนยันจากการเคลื่อนไหวของราคาทองคำที่เคลื่อนที่ต่ำกว่า WMA (30 Shift

Arief Makmur 07:19 2025-03-25 UTC+2

การวิเคราะห์ทางเทคนิคของการเคลื่อนไหวราคาภายในวันของคู่สกุลเงิน EUR/JPY, วันอังคารที่ 25 มีนาคม 2025

จากสิ่งที่เห็นในกราฟ 4 ชั่วโมงของคู่สกุลเงิน EUR/JPY สามารถเห็นได้อย่างชัดเจนว่า EUR/JPY กำลังอยู่ในสภาวะการแข็งตัว ซึ่งแสดงให้เห็นจากการเคลื่อนที่ของราคาที่เดินหน้าอย่างสอดคล้องในช่องแนวโน้มขาขึ้น และยังมีการเคลื่อนที่ของราคาที่สูงกว่าค่า EMA (21) และตัวชี้วัด Stochastic Oscillator ที่แสดงการ

Arief Makmur 07:19 2025-03-25 UTC+2

การคาดการณ์ EUR/USD สำหรับวันที่ 25 มีนาคม 2025

เมื่อวันจันทร์ ยูโรปรับตัวลดลง 14 จุด มีการพยายามปรับทิศทางขึ้น ซึ่งในวันนี้อาจมีการพยายามอีกครั้งและอาจประสบความสำเร็จมากขึ้น แม้ว่าระดับแนวรับที่ 1.0762 จะยังไม่ได้รับการทดสอบก็ตาม แน่นอนว่าการกลับตัวของราคาไม่จำเป็นต้องเกิดขึ้นที่แนวรับปัจจุบันเสมอไป แต่ความใกล้เคียงของมันทำให้เกิดความไม่แน่นอน ในขณะเดียวกัน ออสซิลเลเตอร์ Marlin แสดงให้เห็นถึงความตั้งใจที่จะกลับตัวขึ้นโดยไม่แตะที่เส้นศูนย์

Laurie Bailey 04:59 2025-03-25 UTC+2

การคาดการณ์ GBP/USD สำหรับวันที่ 25 มีนาคม 2025

เมื่อวานนี้ ค่าเงินปอนด์อังกฤษเพิ่มขึ้นสี่ pip ทำให้ตัวออสซิลเลเตอร์ Marlin ลดต่ำลงและแตะกับเส้นศูนย์ ตอนนี้เราสามารถคาดหวังสัญญาณขาขึ้นที่ชัดเจน และราคาจะเพิ่มขึ้นไปยังระดับเป้าหมายที่ 1.3101 เราไม่คาดหวังว่า Marlin oscillator จะทำการเคลื่อนไหวผิดพลาดไปในทิศทางขาลง ซึ่งหมายความว่าเราไม่คาดว่าจะลดลงไปยังช่วงเป้าหมายที่ต่ำที่ 1.2816

Laurie Bailey 04:59 2025-03-25 UTC+2

การคาดการณ์ AUD/USD สำหรับวันที่ 25 มีนาคม 2025

ดอลลาร์ออสเตรเลียสามารถหลีกเลี่ยงการลดลงต่ำกว่าขอบด้านล่างของช่วงแนวโน้มด้านข้าง และเพิ่มขึ้น 11 pip เมื่อวานนี้ อย่างไรก็ตาม เส้นตัวบ่งชี้สมดุลในมาตราส่วนรายวัน (เส้นค่าเฉลี่ยเคลื่อนที่สีแดง) ยับยั้งไม่ให้ราคาขยับขึ้นได้มากกว่านี้ วันนี้ ราคาจะพยายามปิดเหนือเส้นนี้ หากสำเร็จก็อาจนำไปสู่การเคลื่อนไหวไปยังขอบบนของช่วงที่ 0.6351 ซึ่งคือสถานการณ์หลัก การรวมตัวต่ำกว่าระดับ

Laurie Bailey 04:59 2025-03-25 UTC+2

สัญญาณการซื้อขายสำหรับทองคำ (XAU/USD) ในวันที่ 24-27 มีนาคม 2025: ขายต่ำกว่า $3,032 (21 SMA - ซื้อมากเกินไป)

ในช่วงต้นของการซื้อขายในตลาดอเมริกัน ราคาทองคำอยู่ที่ 3,026 ซึ่งต่ำกว่าค่าเฉลี่ยเคลื่อนที่ 21 วัน และต่ำกว่าระดับ 7/8 ของ Murray เราคาดว่าราคาจะยังคงอยู่ในระดับต่ำกว่าโซนนี้ในชั่วโมงต่อ ๆ ไป หลังจากที่เคยขึ้นไปแตะที่ 3,058

Dimitrios Zappas 16:44 2025-03-24 UTC+2
หากไม่สะดวกคุยในตอนนี้
ระบุคำถามไว้ได้ใน แชท.
Widget callback
 

Dear visitor,

Your IP address shows that you are currently located in the USA. If you are a resident of the United States, you are prohibited from using the services of InstaFintech Group including online trading, online transfers, deposit/withdrawal of funds, etc.

If you think you are seeing this message by mistake and your location is not the US, kindly proceed to the website. Otherwise, you must leave the website in order to comply with government restrictions.

Why does your IP address show your location as the USA?

  • - you are using a VPN provided by a hosting company based in the United States;
  • - your IP does not have proper WHOIS records;
  • - an error occurred in the WHOIS geolocation database.

Please confirm whether you are a US resident or not by clicking the relevant button below. If you choose the wrong option, being a US resident, you will not be able to open an account with InstaForex anyway.

We are sorry for any inconvenience caused by this message.